
Data Visualization
It can be done.
Let’s figure out how...
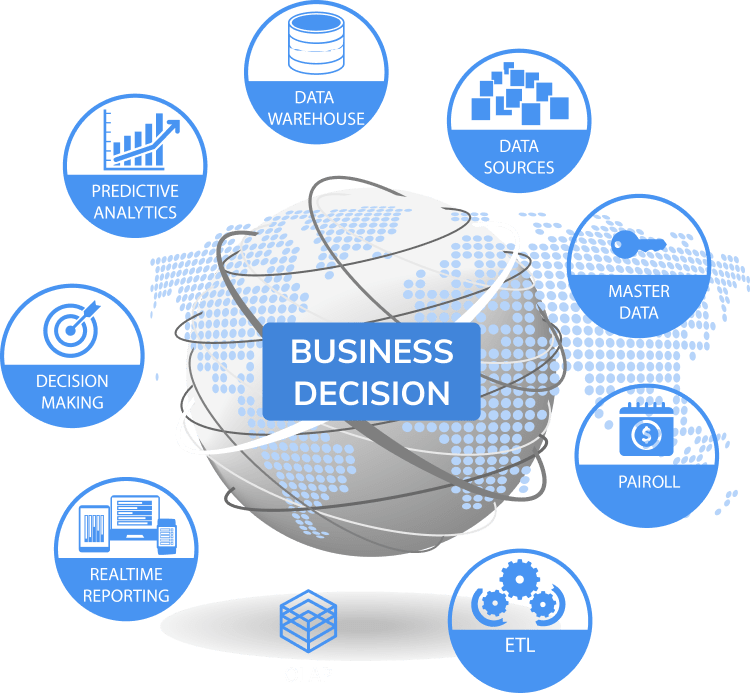
Autymate brings your data
together for quicker, better
business decisions.
Share More

Fast Analytics
Connect and visualize your data in minutes. Autymate is 10 to 100x faster that existing solutions.
Big Data, Any Data
From spreadsheets to databases to Haadoop to cloud services, explore, any data.

Update Automatically
Get the freshest data with a live connection to your data or get automatic updates on a pre-defined schedule.
Ease of Use
Analyze data with intuitive, drag & drop products. No programming required, just business savvy and insight.
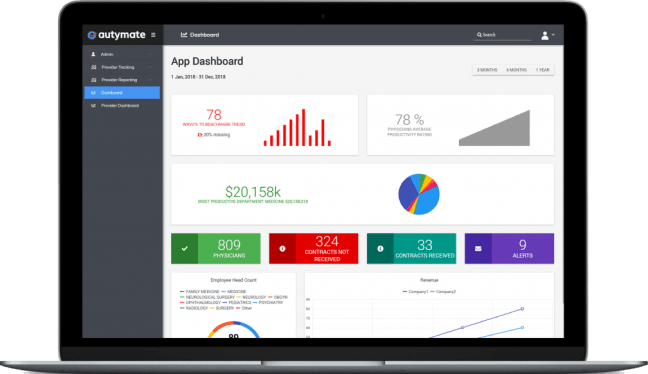
Smart Dashboards
Combine multiple views of data to get richer insight. Best practices of data visualization are baked right in.
Share in Seconds
Publish a dashboard with a few clicks to share it live on the web and on mobile devices
Benefits of Data Visualization

Tap into the true potential of your data.

Retrieve data almost instantaneously.

The team can find the data they require without consulting IT staff.

Higher gross margins.

Increase data accuracy.

Team members can use their time more efficiently.
Customize Your Views
Customize your visualization
Create pie charts, graphs, interactive maps, and other visualizations of your data with just a few clicks.
Alerts
Set alerts to be notified of data changes.

Real Time Updates
Confidence you always have current reports with real-time data updates.

Refine the data
Add or remove data points, create calculated fields, and filters.

Annotate
Annotate the chart data for further commentary and discussion.

Governance
Use our governance tools to further refine and control who has access to what data.